A few months ago I found the DEFCON2019 Volatility Memory Forensics challenge and decided to take a look. Memory Forensics are a personal favorite of mine so I thought this might be an interesting way to test my skills. Cyberdefenders.org keeps a copy of this challenge on their server so you can try along with me if you want.
I found this challenge to be a nice beginner challenge to Volatility. Most of the concepts weren’t too challenging and it taught a lot of introductions to memory forensics techniques. I even liked this so much that I used it as a baseline to teach memory forensics to my analysts. I wanted to post my walkthrough here.
1. What is the SHA1 hash of triage.mem (memory dump)?
Challenge starts off easy by asking for a SHA1. Using the command sha1sum Triage-Memory.mem will give us the answer.
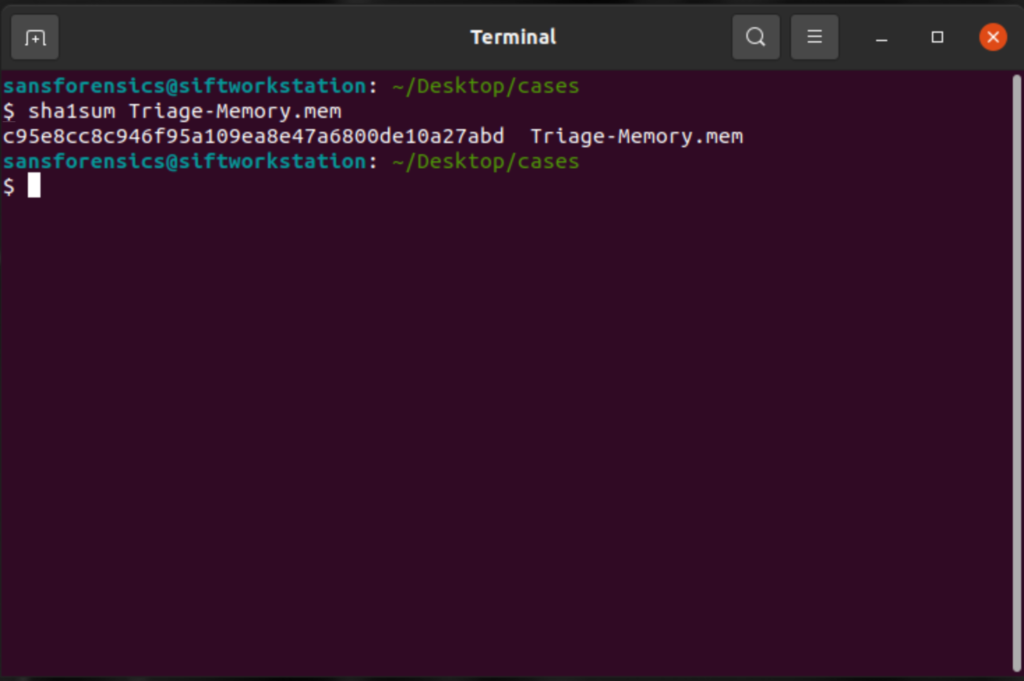
Taking a hash of whatever file you’re about to work with is incredibly important because it can be used to prove that you haven’t altered the file in anyway after you’re done analyzing it.
2. What volatility profile is the most appropriate for this machine? (ex: Win10x86_14393)
We’re still in easy territory with this CTF. Whenever starting a case on memory forensics, we have to first know what type of memory image we’re looking at. This is important because every operating system, and in the case of Windows 10 every update, places objects in different parts of the memory. In order for volatility to accurately return information from the memory image it needs to know the correct place to search in the memory for different things.
To answer this question we must first run
vol.py -f Triage-Memory.mem imageinfo 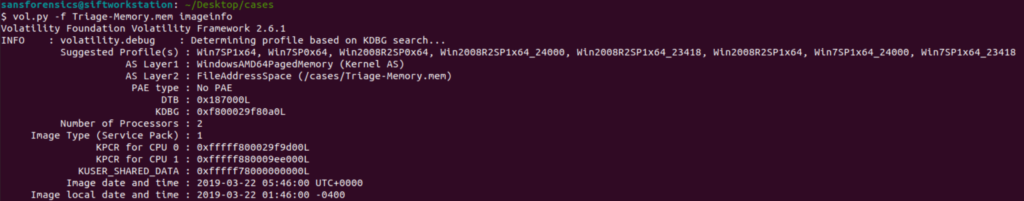
Image info will return several different suggested profiles for us to use. Remember each version of windows places things in various locations so it’s important that we pick the correct one.
Since this is a CTF the easiest way to check is to just copy and paste each one individually until you get the one that awards you points but let’s imagine that you’re doing this in real life. How can you tell which of these suggestions is correct?
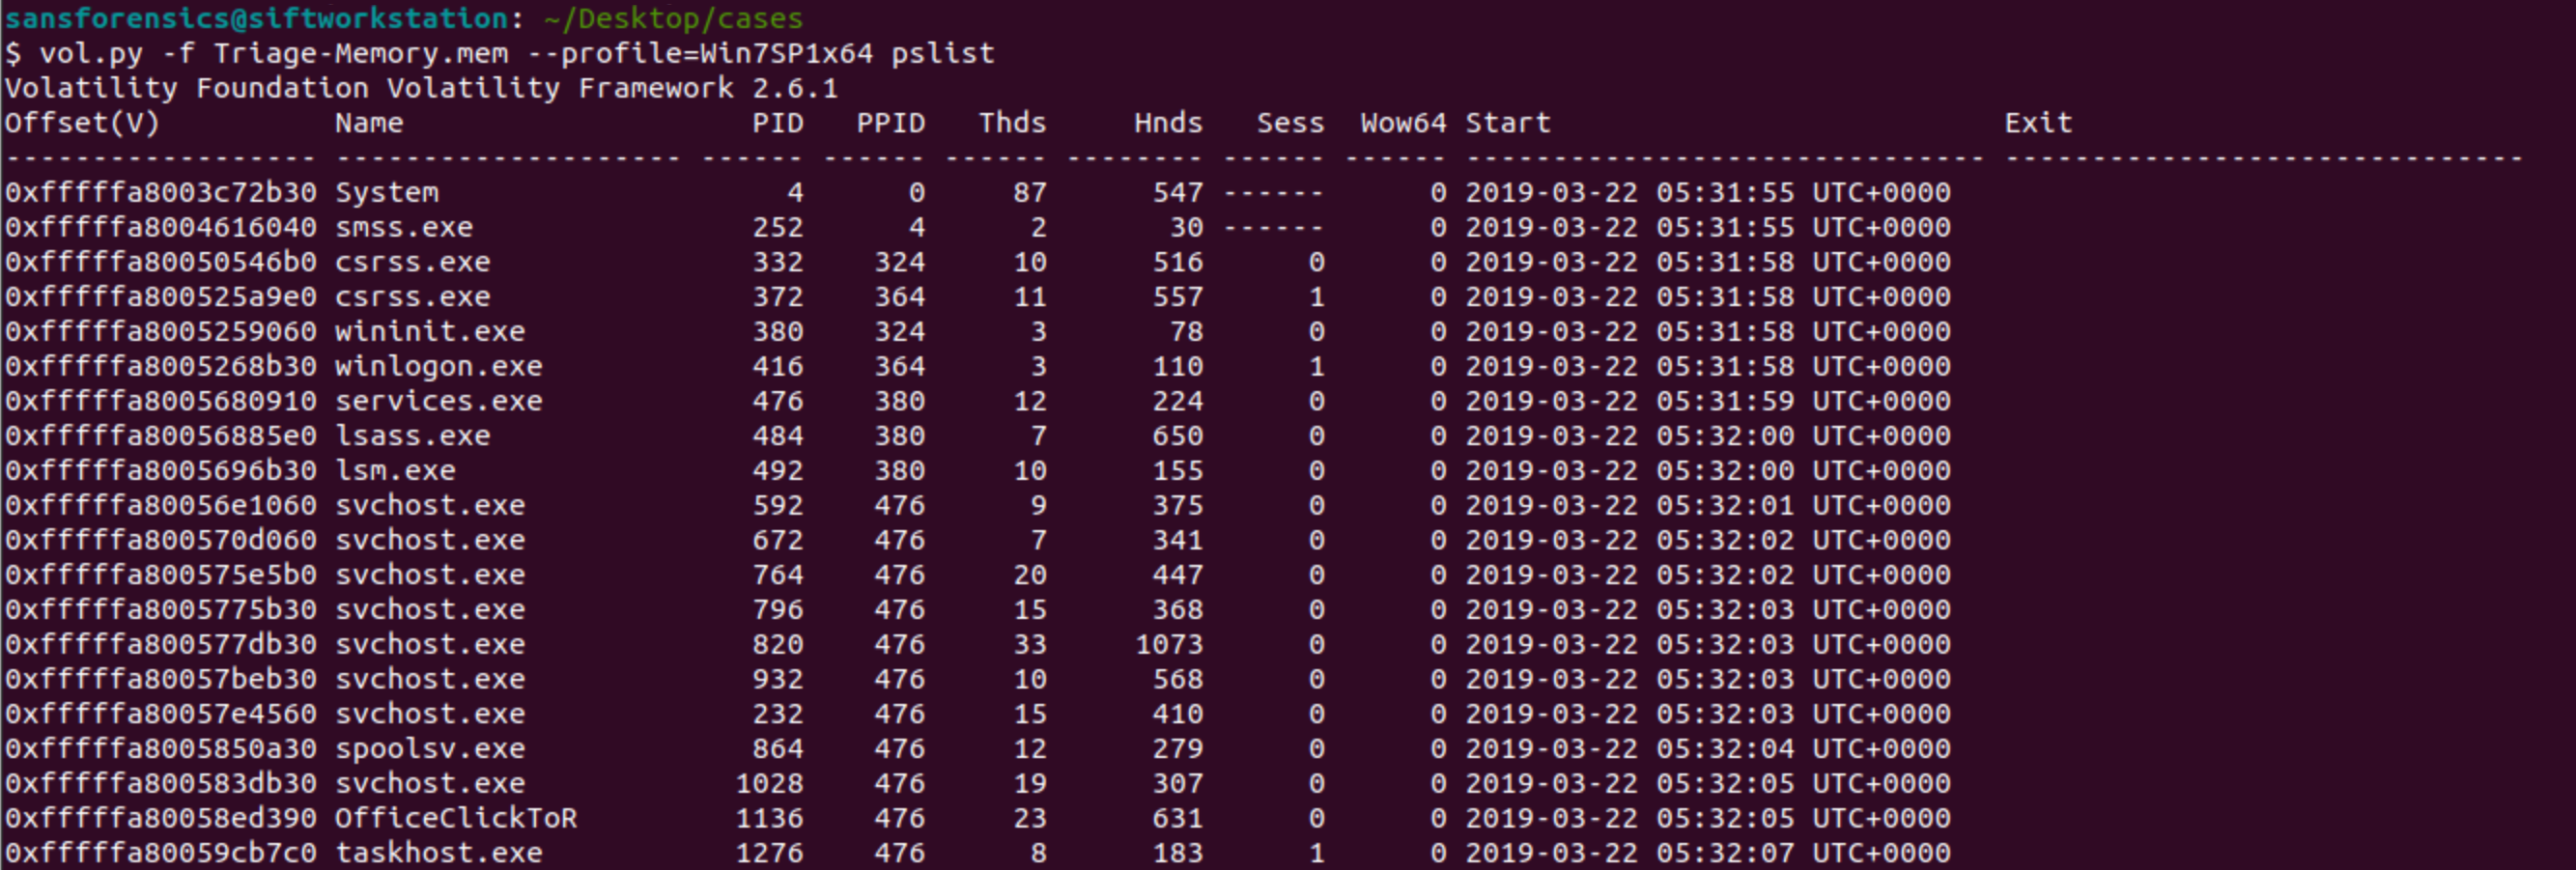
The “correct” way to do this is to read Microsoft documentation for each of these updates and find which one has the correct KDGB value. The faster way to do this is to take a command that you know what the expected output is and try different profiles to see which one gives you the correct output. For me personally that command is pslist because I know that an incorrect profile image will result in “odd output” instead of program names.
Correct profile

Incorrect
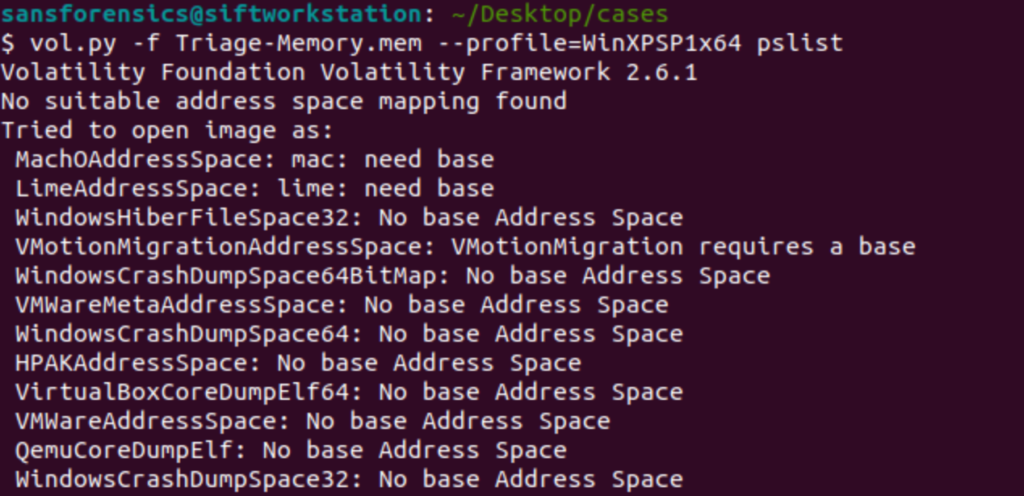
This is an easy, albeit not super quick, way to discover the correct profile. In this case the correct profile is Win7SP1x64.
Short note:
Now that you’ve found the correct profile for the image it’s useful to set up some shortcuts so you aren’t retyping the location of the image and profile with ever command. Volatility has a shortcut to do this but I’ve personally found aliases to be even quicker to set up. I’m going to set an alias so that the letter v will run my volatility.
alais v="vol.py -f Triage-Memory.mem --profile=WinSP1x64"Remember in Linux case sensitivity matters.
What was the process ID of notepad.exe?
Now that we have our alias set up we can get to running some actual commands. To answer this question the command we’ll use is pslist, although pstree would also work.
v pslist | tee pslist | grep -i "notepad" 
Let’s cover this command real quick. First, I run volatility to pull processes then I use grep to search specifically for notepad. I’m familiar with how pslist formats things so I know that the PID is the first set of numbers after the program name and the parent PID (PPID) is the second number.
About tee
From here on out you’ll see me use the tee command with every command. The tee command does two things; first, it puts everything to STDOUT (terminal) and second, it writes everything to a text file. This becomes incredibly useful when conducting investigations because some of the commands will take a LONG time to run. Using tee to write them out to a text file will save you time by giving you the ability to grep through the file without having to rerun the command.
Name the child process of wscript.exe.
There are a few ways that you could go about doing this. The first way would be to grep for wscript.exe, look at the PID, then grep for any process that has that as a PPID. Another option is to use the pstree command.
v pstree | tee pstree | grep -A 1 -i "wscript.exe"
Using this command we can see that the child process of wscript is UQkpjFjFzM.exe, that’s not suspicious at all.
What was the IP address of the machine at the time the RAM dump was created?
So I’m not a huge fan of the question as it has two possible answers and it’s not clear which one it actually wants. The question could be talking about the Public WAN address the computer was at or the Private LAN address of computer.
The question is actually looking for the private LAN address so we’ll take a look for that.
v netscan | tee netscan
Take a quick look for a private IP address that’s using a service like Chrome to communicate out and you probably have the computer’s Private IP.
While we’re here did you notice anything usual? (We’ll get to it later).
This box was exploited and is running meterpreter. What was the infected PID?
Alright, another note. This question appears out of order in the actual CTF. This question is the last question in the CTF and the next question specifically references this question before this question actually appears. For the sake of clarity, I’ve rearranged this.
Remember when I said earlier that using tee to write outputs to a text file would save us time? This is one of those instances. We already have the files we need. If you go back two questions you might notice that strangely named exe spawned by wscript. It’s a very strange name but what else can we do? Since the question specifically mentions meterpreter we can make an assessment that our adversary might be using meterpreter defaults. Since I’ve practiced with metasploit before I know that meterpreter defaults to port 4444 for its command and control. Let’s take a look for a PID using port 4444.
grep -i ":4444" netscan
And there we are. Our strangely named executable again, and it’s PID (3496) right next to it.
Based on the answer regarding the infected PID, can you determine the IP of the attacker?
(See why I said I think these questions are out of order? This question comes 10 questions before the previous question).
If you answered the previous question by pulling the PID from the pslist file then you’ll need to grep the netscan for that executable name and find the attacker IP. Since I took the other route of looking for port 4444 I have the IP of the attacker, 10.0.0.106.
How many processes are associated with VCRUNTIME140.dll?
(So another interesting thing about this CTF is that this isn’t the original question. I did this CTF at DEFCON and this wasn’t the regular question, but oh well; we’ll answer it anyways.)
v dlllist | tee dlllist | grep -i "vcruntime140.dll"
The dlllist command will show all dlls loaded in memory and what processes are loading them. By grepping for this specific dll we can see that Office 2016 is loading this dll four times and clicktorun is loading the dll once. This means our answer is 5 processes.
After dumping the infected process, what is its md5 hash?
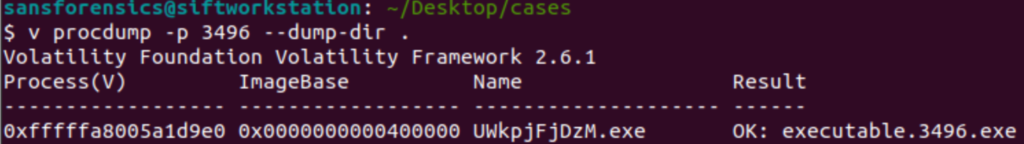
This one is going to be a multi-part answer. In order to get the MD5 hash of the infected process we will first need to carve the process out of memory and then hash it. To carve it out of memory we can use the procdump command to dump the process.
v procdump -p 3496 --dump-dir . This command will carve our the executable loaded in memory using the -p to specify the PID I want to carve.
Once the PID is carved our I can use the md5sum command to hash the file
md5sum executable.3496.exe 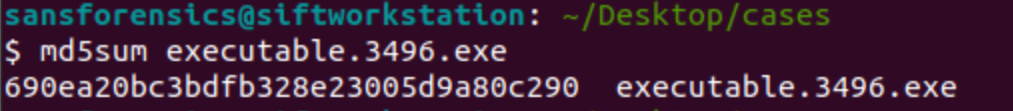
What is the LM hash of Bob’s account?
This was also pretty easy. Volatility has a command built in to dump hashes from the SAM file
v hashdump | tee hashdump | grep -i "bob"
This next part requires a but of understanding about how the SAM file stores hashes. In show the text between the two : after the 1000 is the LM part of the hash. The text between the two : after that is the NT hash.
What memory protection constants does the VAD node at 0xfffffa800577ba10 have?
This question took me a bit of time to figure out as I wasn’t really familiar with VAD protections. I did some research on VAD and discovered the existence of the vadinfo command which will so me information about the virtual address descriptors for a section of memory.
v vadinfo | tee vadinfo | grep -A 5 -i "0xfffffa800577ba10" 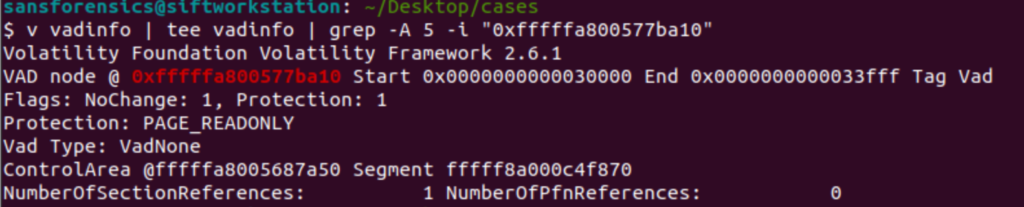
That command took a little while to run but once it completed, I found the information I needed. The protection at the location was PAGE_READONLY.
What memory protection did the VAD starting at 0x00000000033c0000 and ending at 0x00000000033dffff have?
Since I already ran the vadinfo command I don’t need to rerun it; however in this question we have two memory addresses, so we’re going to double grep this.
grep -A 5 -i "33c0000" vadinfo | grep -A 5 -i "33dffff" 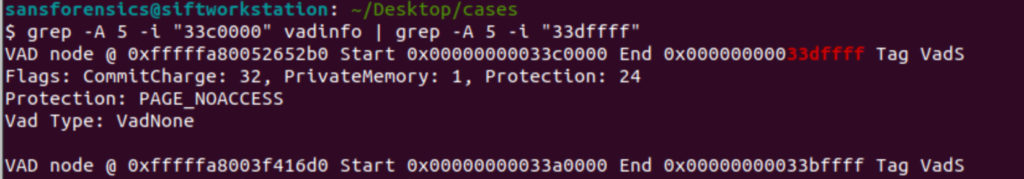
I used the end of the hex in both commands because I figured it would be unique enough to give me only the results, I wanted without requiring me to type out the entire hex address. Sure enough it worked and now I know the protection is PAGE_NOACCESS.
There was a VBS script that ran on the machine. What is the name of the script?
VBS scripts are run from the command line so let’s use the cmdline command to show every command run.
v cmdline | tee cmdline | grep -i ".vbs" 
An application was run at 2019-03-07 23:06:58 UTC. What is the name of the program?
This question was bit tricky. It did take me a moment to remember how I can tell what program was run at a specific time, but then I remembered that the Shim cache will show every time a program gets run.
v shimcache | tee shimcache | grep -i "2019-03-07 23:06:58"
We can see that the program run at that time was Skype.exe
What was written in notepad.exe at the time when the memory dump was captured?
Now this one was very tricky and required me to do a good bit of research to figure it out. My first reaction was to memory dump virtual memory of the notepad process and grep through it for anything with a file with a flag. This didn’t work because of how Notepad stores text. Specifically Notepad stores text in little endian format but the strings command in Linux defaults to big endian, so I needed to fix that.
First however we need find the process of notepad so we can dump it’s memory.
grep -i "notepad.exe" pslistGives us the PID of 3032. Now we need to dump the memory of that process
v memdump -p 3032 --dump-dir .The file generated by this is going to be about 500MBs. Next we’ll need to run strings across the file to try and find the flag, remember we need to specify little endian.
strings -e l 3032.dmp | tee notepad_strings | grep -i “flag<“
Using the -e l option with strings tells the command to specify little endian. After that I used grep to search for a common flag format found in the CTF.
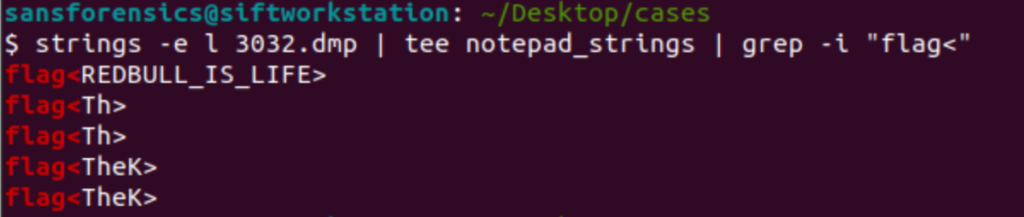
I’m not completely sure what other flags are but the correct flag is “REDBULL_IS_LIFE”
Note:
Using the Strings command is incredibly useful when doing malware triage. Infact its usually the first thing I do to the file. I will string the entire memory image so that I can grep through the strings file for things like websites, IPs, key words, etc. If I see things like that I’ll use the memory address of that string (using the -t o flag) in volatility to find the PID that had that string in it. This can be incredibly useful to find compromised PIDs as something like SVCHOST probably shouldn’t be talking to banking website.
What is the short name of the file at file record 59045?
So short names were a new concept to me. I knew Microsoft did some funny things with naming conventions due to length, but I wasn’t completely sure what the short name was. I found this Microsoft article specifically on shortnames. Basically what happens is that when you create a long name (or a file name longer than the MS-DOS standard) the system also creates an MS-DOS compatible short name to go with it. This means that if we are talking about file names, we should search the master file table. Thankfully volatility has a parser for the masterfile table called mftparser. (note I usually start my greps with an -A 5 to show me 5 lines after but this time that didn’t work so I needed to lengthen the -A to 20 in order to get the relevant information.
v mftparser | tee mftparser | grep -A 20 -i " 59045" 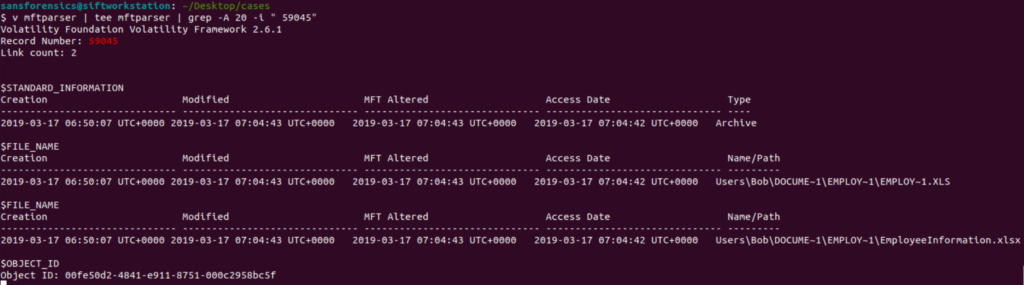
With this now completed with can see the file’s MS-DOS compatible shortname of EMPLOY~1.XLS and the file’s long name of EmployeeInformation.xlsx. The short name concept is definitely interesting to me and something I will need to do more research on to figure out how adversaries could potentially abuse this concept.
Conclusion
There we have it. All the answers for this CTF. I thought this CTF was pretty fun and a good introduction to some basics of volatility. I hope my write up was informative for someone looking to get started with Volatility in the future.